When I started as MIT’s vice president for research, on May 1, 2024, one of the first things I did was collect data to help me understand the state of the research enterprise, aided in this work by our research reporting team in VPR, by MIT Institutional Research, and by the Office of the Vice President for Finance. I presented an in-depth version of this analysis at the December 11 Institute Faculty Meeting and have since recorded a video of the presentation. In light of the unprecedented actions being taken in Washington, DC, which may dramatically impact our research enterprise, I think it is important that we all understand more about how this enterprise works. I encourage members of the MIT community to view this video (Touchstone login required); it contains many more details and insights than I will share here.
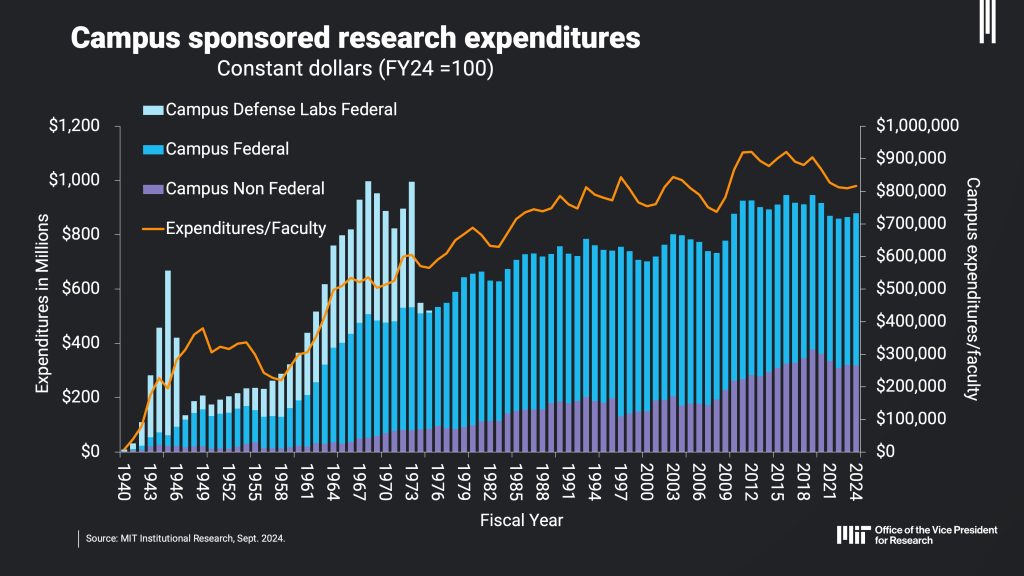
- The MIT research enterprise is remarkable in its breadth and depth. One can see this in many ways — from the fundamental discoveries and new inventions, to the influential publications, to the awards, to the companies formed, to the dynamic new initiatives we have launched. Fueling this, on campus last year we had almost $900M in sponsored research. Combined with $1.5B in sponsored research at MIT Lincoln Laboratory, this represents a significant investment in advancing discovery, innovation, and research-based education, to the benefit of the nation and the world. Over the course of our history, the research enterprise has experienced remarkable growth, even when corrected for inflation and faculty size. The chart below shows campus sponsored research expenditures, and expenditures per faculty, in constant dollars from 1940 to 2024.
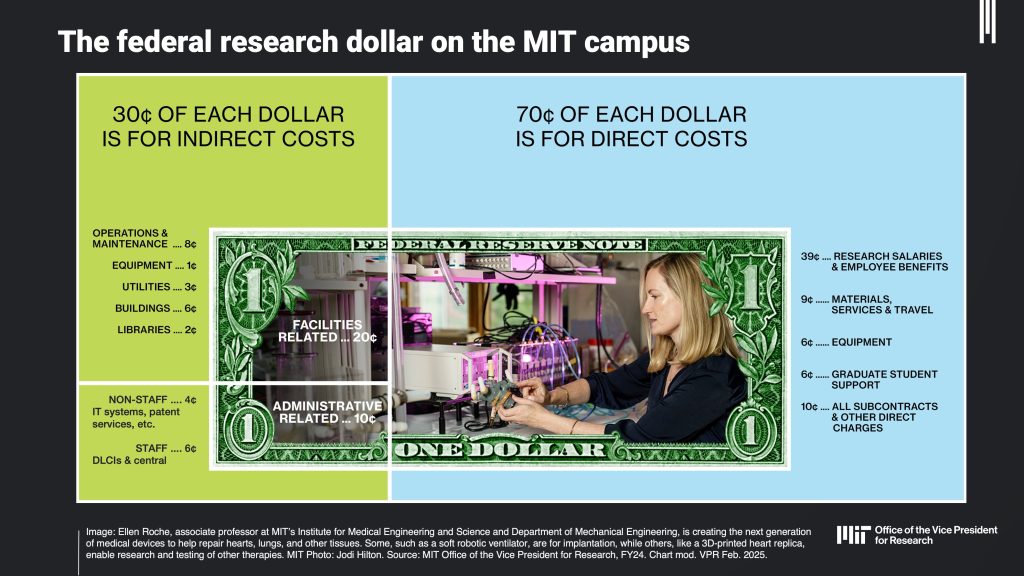
- If we consider only the last fiscal year, our sponsored research volume was $879M. This was composed of $660M in direct costs (i.e., those costs that can be easily identified with a particular research project) and $219M in indirect costs. These indirect costs are real costs borne by MIT to support individual research efforts, but they are harder to assign to a particular project, so we pool them and assign them to projects at a fixed average rate. They are things like water, electricity, and heating; building depreciation, maintenance, and debt; IT costs; environmental health and safety; costs for shared core facilities; staff to maintain and fix facilities; and staff to administer the research contracts and grants in the face of rapidly growing compliance needs (see COGR’s Figure 1 here). What many people don’t appreciate is the relative magnitude of these indirect costs. For every federal research dollar at MIT, about 70 cents is composed of direct costs, and 30 cents is indirect costs. Of that 30 cents, most (20 cents) is for facilities costs, which largely support buildings. Only 10 cents is administrative related, and of that, 4 cents is for IT systems, patent services, and other non-staff costs. The remaining 6 cents is for staff who administer our research enterprise in support of 90 different DLCIs, 1,500 PIs, about 1,500 postdocs, and over 5,000 graduate students doing research. Many such staff work directly with PIs in the DLCIs; others are in central offices (e.g., finance, research administration).
- Importantly, the roughly $900M in sponsored research on campus represents a little over half of the funds that sustain the campus research enterprise. The other half can be characterized as a co-investment by MIT. An estimate for these co-investments is shown below. The Institute’s own investment in the strength of the research enterprise does a number of important things. It pays the portion of faculty salaries that are devoted to research (55% on average, based on faculty surveys) but not billed to sponsored accounts, ensures top-tier graduate students can thrive here amid the high cost of living, supports departmental research activities, absorbs F&A under-recovery on certain grants, and more. In valuable, tangible ways, it keeps MIT competitive with its peers and helps keep the U.S. at the forefront of global science and technology.
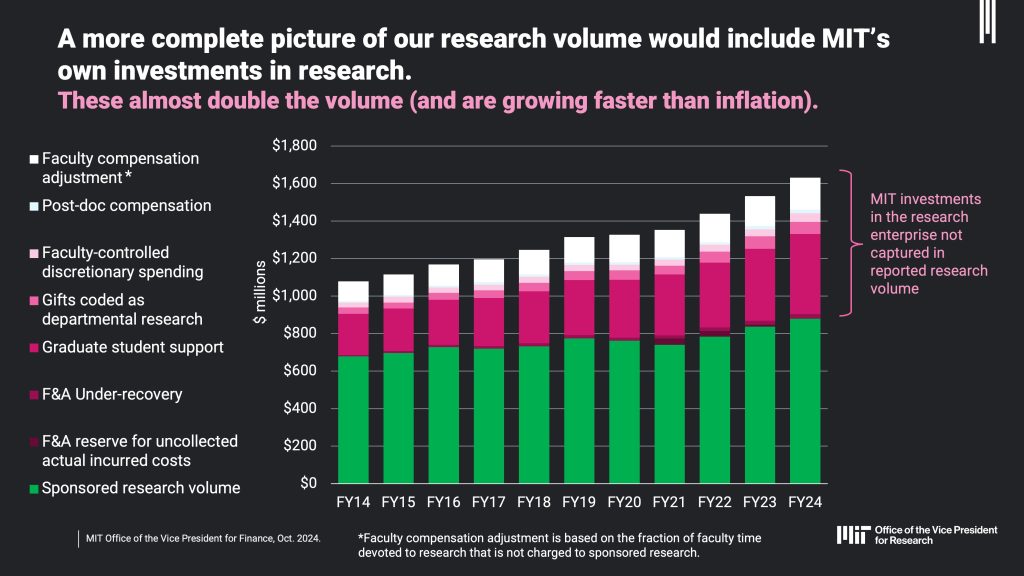
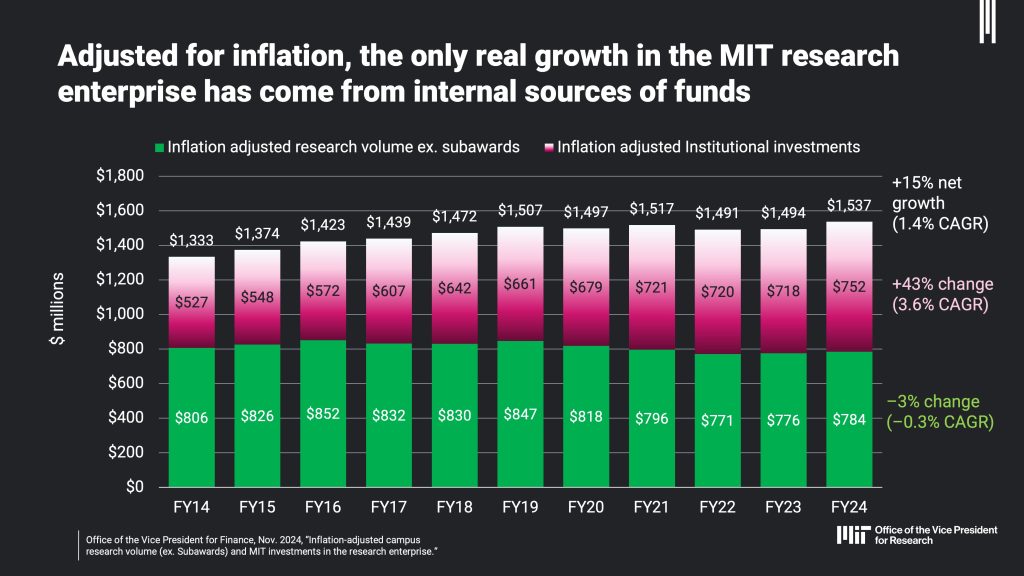
- As shown below, when correcting for inflation over the last 11 years, the total on-campus research enterprise has grown by about 15%. Over this same time, sponsored funding has been essentially flat (-3%), so that all real growth in the research enterprise has come from MIT’s own resources. This occurred during a period that included the global pandemic. In this chart I have removed the portion of sponsored research funding that flows to external collaborators via subawards in order to focus only on the work done on our campus. MIT’s investments are currently almost equal to the total sponsored research funding spent on our campus.
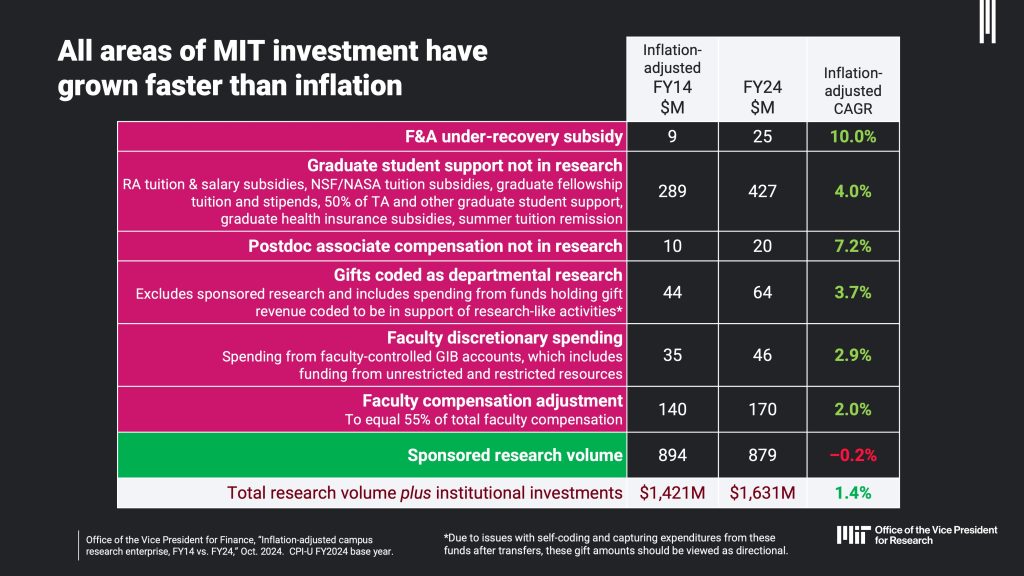
- The sources of growth in MIT’s investments in research are shown in the following table. The FY14 column has been inflation-adjusted to be directly comparable to the FY24 column. The single largest source has been an increase in investment in graduate student support, which is a direct result of the performance or our endowment over this period. Notably, the number of research master’s and PhD students has not grown significantly over this same period: +4% (0.4% CAGR), which is less than the 7% growth in the faculty (0.6% CAGR). The number of postdocs has decreased by 2% (-0.2% CAGR). So, the dramatic growth in MIT’s investments to support graduate students has served to offset the need for sponsored-research funding to support these students.
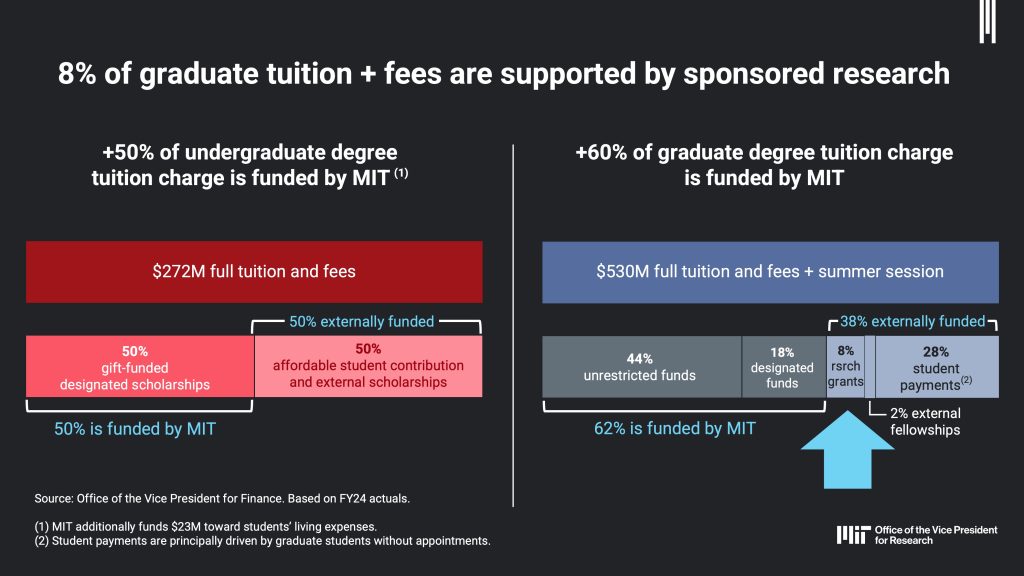
- Indeed, it is remarkable that only 8% of the total graduate student tuition is now charged to sponsored research projects at MIT. (There is an equally remarkable story to tell on the undergraduate side: When measured in real dollars, the average cost of an MIT undergraduate education for those who receive financial aid has been reduced by 32% over the past two decades as a result of our dramatic increase in support for undergrads as well.)
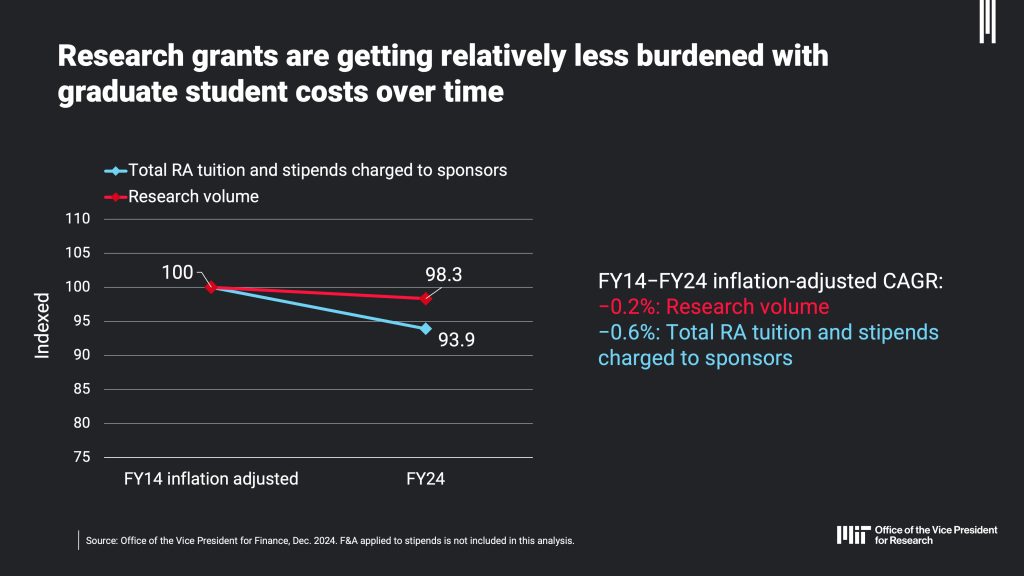
- These trends run counter to the perception some have that graduate student costs have grown unbounded. It is true that costs to a grant per graduate student supported have grown faster than inflation (3.4% versus 2.8% CPI over the past 11 years), even when accounting for the increased tuition subsidy and new centrally funded benefits. This is because of the growth in stipends driven by our commitment to provide livable wages to our graduate students during a period when local housing costs increased significantly. However, fewer contracts and grants are being charged for research assistants because we have provided more support for students on fellowships. In the end, the net cost of graduate students to contracts and grants has fallen in real terms, as shown below.
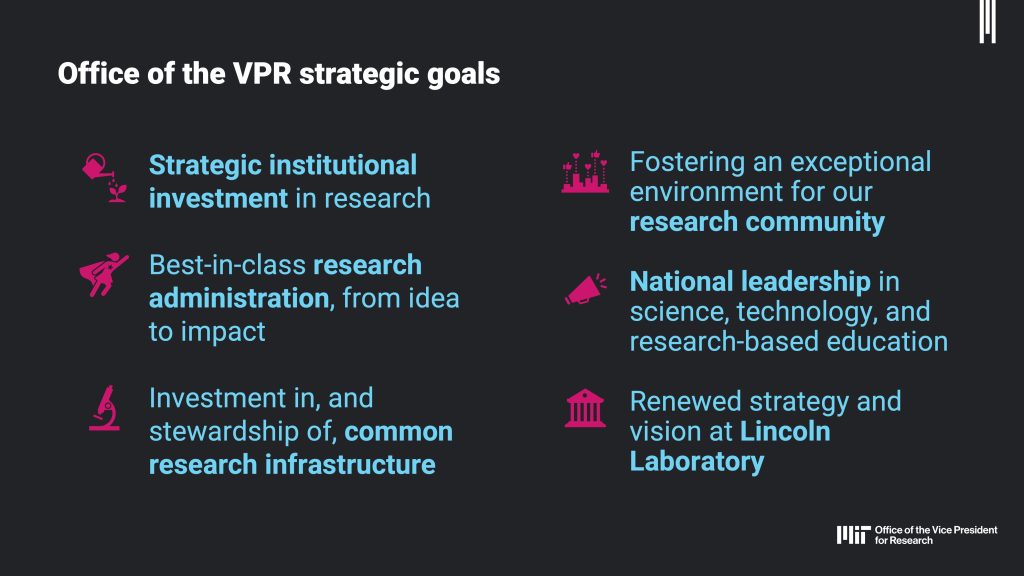
- In the internal video linked above, I discuss the research enterprise in more depth. For example, I provide information on the growth in federal compliance requirements and the implications for research administration staff (95 people in OVPR, and another 270 in the DLCIs); how many proposals our faculty and PIs write, and the success rates over time; and a variety of other interesting ways to characterize the functioning of the enterprise. With these and other data as a foundation, we have developed a broad strategy to advance the research enterprise across six key areas. For anyone who would like to learn more about the details, or the broader strategy outlined in the bullets below, I am happy to come to any MIT DLCI to share more.