

MIT Women and Men Faculty in Science and Engineering as Founders and Board Members of Companies in Science and Technology
A Report from the Data Group of the
Boston Biotech Working Group((BBWG Data Group
Sangeeta Bhatia is John and Dorothy Wilson Professor, Electrical Engineering and Computer Science (sbhatia@mit.edu);
Nancy Hopkins is Professor Emerita, Department of Biology (nhopkins@mit.edu);
Sonia Liou is Assistant Director, Office of Institutional Research (sliou@mit.edu);
Lesley Millar-Nicholson is Director, Technology Licensing Office and Director, Catalysts (lesleymn@mit.edu);
Fiona Murray is Professor, Sloan School of Management (fmurray@mit.edu);
Dylan Nelson is a PhD candidate, Department of Sociology, University of Michigan (dknelson@umich.edu);
Teresa Nelson is a Professor at Simmons University Business School (teresa.nelson@simmons.edu);
Lydia Snover is Director, Office of Institutional Research (lsnover@mit.edu).))
Introduction
As part of the Boston Biotech Working Group (BBWG) effort, a Data Group was established to better understand and track forward participation of women and men faculty members in the governance of science and technology companies. Many studies have documented significant underrepresentation of women faculty in these activities, including in biotech, but individual institutions involved in the BBWG are interested in establishing consistent methods and policies for gathering and reporting data on their faculty, and in obtaining public data to establish baselines to measure and compare changes over time and across various academic units.
Preliminary data gathered informally had already shown that women faculty in the biological sciences at MIT and Harvard participate in these activities much less frequently than male colleagues, and comparatively less than women faculty in some MIT engineering departments (Bhatia and Hopkins, unpublished). Importantly, a comprehensive Stanford University study using data from the university’s Office of Technology and Licensing for engineering departments and Stanford’s medical school and basic biology departments, had documented very similar differences (Hanes, et al. 2018). Our BBWG Data Group began by collecting comprehensive, up-to-date data for several departments in the Schools of Science and Engineering at MIT, thus establishing methodology as well as collecting baseline data for this institution. Funded by the Sloan Foundation and supported by MIT, this research project was launched in the summer of 2019. Below we present a report thereon.
The Research Project
Beginning with an official list of current MIT faculty, prepared by MIT’s Office of Institutional Research (IR) for June 2019, a historical database was built from public sources of faculty member participation as for-profit business founders, board of director members and scientific advisory board members((Outside Professional Activities forms (OPAs) were not used as a data source for this study as that information is a confidential personnel record available only to the Provost and a limited number of other individuals within MIT.)) in science and technology companies. The study encompasses faculty in seven MIT departments in the Schools of Science and Engineering.
The goal of this study is to compare the commercialization activity of female and male faculty members, departments, and Schools (Science vs. Engineering), both currently and historically. Our results to date reveal variable rates of participation by women faculty in different departments and confirm a striking underrepresentation of women in Biology compared to their male peers, but they also show a greater participation by women faculty in some Engineering compared to Science departments.
Methodology
The sample for the study includes tenure-track, full-time faculty in seven of the 14 Science and Engineering departments: Biology, Chemistry, and Brain and Cognitive Sciences (School of Science) and Electrical Engineering and Computer Science, Biological Engineering, Chemical Engineering, and Materials Science (School of Engineering). We originally also included Physics, but it was dropped due to low relative commercialization activity. Data collection entailed searches of more than 35 publicly available data sources drawn from categories such as general business (e.g., Pitchbook, Capital IQ), specialized business press (e.g., Factiva, Wall Street Journal, Xconomy, MIT news sources), general internet searches, company websites, books, and professional information sources (e.g., CVs, LinkedIn). The work of data collection was conducted by a team of nine that included five undergraduate students, three PhD students, and one tenured faculty member, Professor Teresa Nelson, who has experience in the fields of science and technology innovation, women and gender, and organizational governance data collection. The team estimates their number of individual searches as greater than 15,000, including structured confirmation to test for reliability. Data analysis and interpretation was performed by Nelson and by MIT and Harvard faculty who work in relevant STEM fields, and with input from additional members of the BBWG. (See Appendix for expanded description of methodology.)
Select Findings
MIT has approximately 1,050 faculty members, of whom 250 are women (June 2019). Faculty hold appointments in departments that are housed in one of five Schools: Architecture, Engineering, Humanities, Science, or the Sloan School of Management. Business commercial activities can occur in all five Schools, but those of interest to the BBWG are centered in the Science and Engineering departments, so we focused our study on Biology, Brain and Cognitive Sciences, and Chemistry (School of Science) and Biological Engineering, Chemical Engineering, Electrical Engineering and Computer Science, and Materials Science (School of Engineering). The seven departments of study house 337 faculty members, of whom 73 (22%) are women.
1. Initial data analysis of seven Science and Engineering departments (see Table 1):
- The total number of commercialization governance events (taking multiple participations per faculty member into account) is 1,042, including 243 board of directors memberships, 489 scientific advisory board memberships, and 310 founding events, resulting in 263 companies. (There are fewer companies than company founding events due to co-founding by MIT faculty.) Women faculty accounted for 93 of this total (9%), including 16 board of directors memberships, 53 scientific advisory board memberships, and 24 founding events, accounting for 24 companies.
- The percentage of male faculty members who have founded at least one company is 40% and that of women faculty members is 22%. The percentages of male faculty members who have served on a board of directors or scientific advisory board are 31% and 39%, respectively, and the corresponding figures for women faculty members are 14% and 30%.
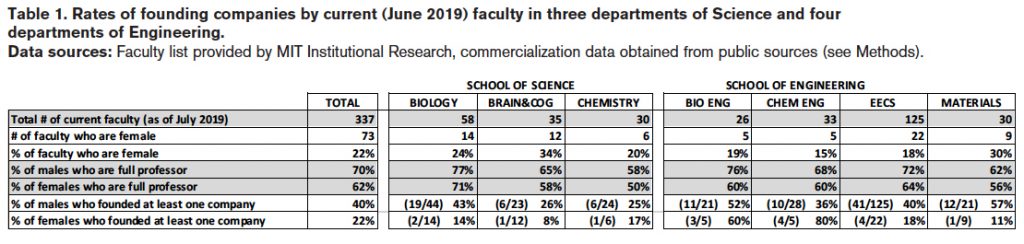
Striking observations that emerge from Table 1 are the variation in commercialization participation rates by female and male faculty in different departments, and the small fraction of faculty who are female in some departments.
Variable rates of participation could have multiple explanations, and small sample size might easily account for some variability. Most companies (85-90%) are founded by tenured faculty, so age and career-stage differences by sex and department were examined: Table 1 shows similar proportions of full professors across the departments studied. However, subfields even within a single department can have very different rates of commercialization, so the distribution of women vs. men in different subfields in each department requires attention by faculty with knowledge of the fields and individuals.
2. Further analysis of three departments: Biology, Biological Engineering, Chemical Engineering
To better understand the variable rates of participation, and because our group is particularly interested in biotechnology, we looked in more detail at Biology (School of Science), and Biological Engineering and Chemical Engineering (School of Engineering). Faculty in these departments have played an important role in the rise of the biotech industry in Kendall Square over the past 40 years, and male and female faculty in each department are sufficiently similar in age and likelihood of commercialization by field.
Biology Department
There are 58 faculty members in the department, of whom 14 are women (24%) (June 2019). The commercial-engagement activity of the Biology department faculty is shown graphically in Figure 1 and summarized graphically in Figure 2, and numerically in Table 2. The total number of “company founding events” do not represent a 1:1 correspondence with total number of founded companies, as some faculty members co-found companies with other MIT faculty members. Our data show that:
- 43% (N=19/44) of male faculty members founded companies while 14% (N=2/14) of female faculty members founded companies, for a total of 65 company founding events[2]: 63 by men, two by women.
- 65 company founding events by Biology faculty resulted in 55 companies founded by male faculty and two by female faculty.
- Of the 57 companies founded by Biology faculty, eight were co-founded((Co-founding a company is considered a founding event in this analysis, and, therefore, discrepancies are expected between this number and the number of companies founded. This study does not consider co-founders who were not MIT faculty members.)) by 11 different members of the Biology faculty, and three from other MIT departments. All 14 of these faculty co-founders were male.
- 32% (N=14/44) of male faculty members served on 42 boards of directors (BODs), whereas one female faculty member served on one BOD.
- 55% (N=24/44) of male faculty members and 29% of female faculty members (N=4/14) served on at least one scientific advisory board (SAB). Five male faculty served on exactly one SAB, eight held 2-4 SAB positions, and 10 held 6-13 positions. One female faculty member served on one SAB, and three held 2-4 SAB positions. The 24 men served on 121 SABs, and the four women served on nine (Figure 2).
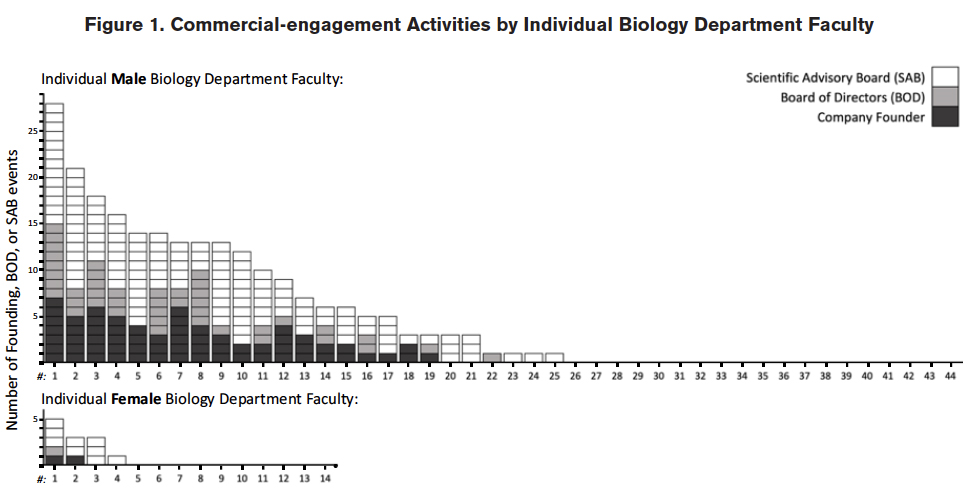
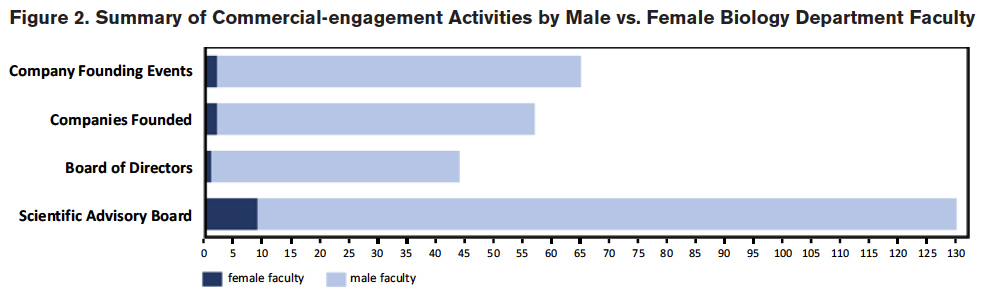
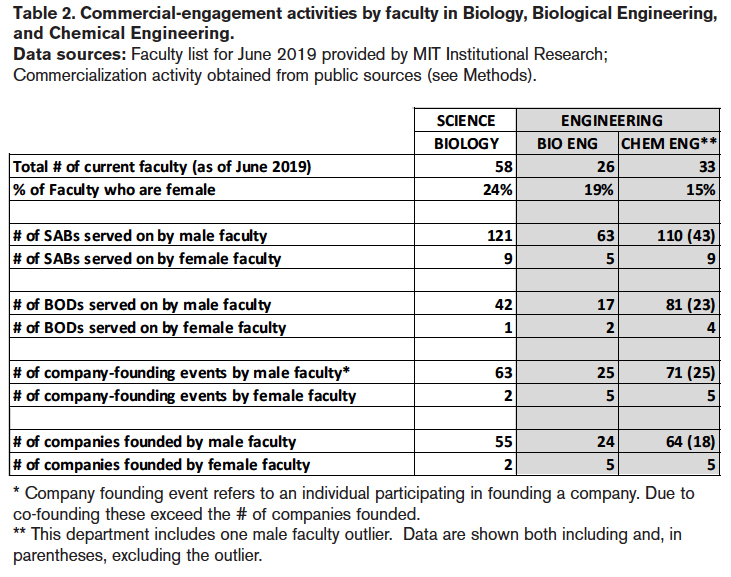
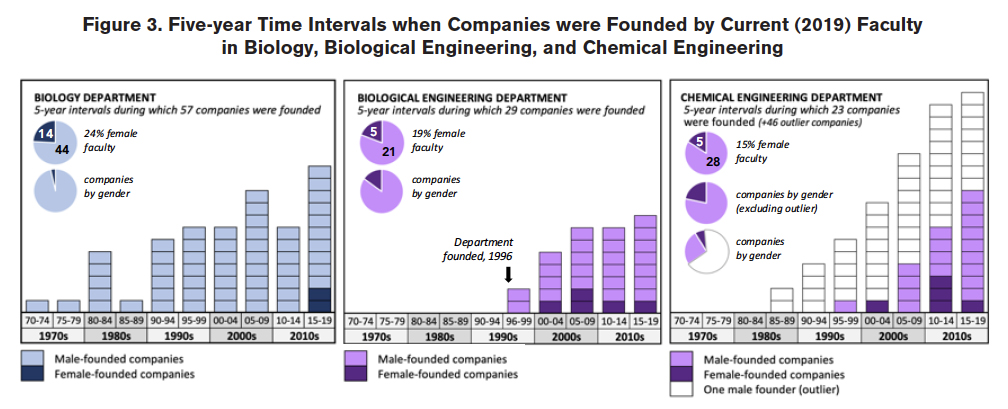
Figure 3, first panel shows the five-year time intervals during which the 57 Biology Department companies were founded. We note the presence of the two female faculty founded companies in the last five-year period and discuss this fact further below.
Biological Engineering and Chemical Engineering Departments
In contrast to Biology, the percentage of women faculty in the Chemical Engineering and Biological Engineering departments is lower (Table 1); however, the rates of commercialization governance engagement are higher.
Biological Engineering. This department has 26 faculty (N=5 women, N=21 men). Women faculty participate in commercialization activity at rates similar to male colleagues. The data show that:
- 52% (N=11/21) of male faculty members founded companies while 3/5 (60%) of female faculty members founded companies, for a total of 30 company founding events2 that resulted in 29 companies: 24 companies were founded by male faculty, five were founded by female faculty.
- 38% (N=8/21) of male faculty members and 1/5 female faculty served on a board of directors.
- 57% (N=12/21) of male faculty members and 3/5 female faculty members served on at least one SAB. Four male faculty held one SAB position, five male faculty held 2-4 SAB positions, one held 5-15 SAB positions, and two held greater than 15 SAB positions. One female faculty member held one SAB position, and two held 2-4 SAB positions.
Of the 29 companies founded by faculty from this department, seven were co-founded by eight MIT faculty members (from this department and others). 8/8 co-founders were men. The five-year time intervals during which the 29 companies were founded is shown in the middle panel of Figure 3.
Chemical Engineering. Chemical Engineering has 33 faculty (N=28 men, N=5 women). As shown in Table 1, most of the women faculty in this department are involved in commercialization, including founding companies. The data in Tables 1 and 2 and some data not shown reveal that:
- 36% (N=10/28) of male faculty members founded 64 companies while N=4/5 (80%) of female faculty members founded five companies, for a total of 76 company founding events2.
- 36% (N=10/28) of male faculty members and N=3/5 (60%) of women faculty members served on a board of directors.
- 46% (N=13/28) of male faculty members and N=4/5 (80%) of women faculty members served on at least one SAB. Two male faculty held one SAB position, seven held 2-4 SAB positions, three held 5-10 SAB positions, and one held more than 60 SAB positions. One female faculty member held one SAB position, and three held 2-4 SAB positions.
Nineteen companies were co-founded by Chemical Engineering faculty, none with a female MIT faculty member in any of the seven departments studied. The five-year time intervals during which all companies were founded is shown in the right-most panel of Figure 3.
We conclude that women faculty in the Biological Engineering and Chemical Engineering departments commercialize at rates that are similar to male colleagues and have done so for many years.
Comparing across the three departments – Biology, Biological Engineering, and Chemical Engineering – shows that women faculty in the two Engineering departments (N=10) founded five times as many companies as women faculty in Biology (N=14), a result we discuss further below.
3. Outcomes of companies founded in the three departments
So far, our study has focused only on faculty participation rates as founders of start-up companies. An additional question of interest would be the types of companies founded and whether they differ between men and women faculty or between faculty in Science vs. Engineering. Biotech and other start-ups differ in the types of products or services they deliver. Companies may be small, medium, large, pubic, private, sustained, or short-lived, and in life sciences may span areas such as tools, medtech, diagnostics, digital health, and therapeutics. As such, there is no universal measure of impact. As a starting point we identified key governance-transition events: going public, being acquired by another company, receiving venture-capital investment, and closure((The “closed” category includes firms that dissolved their corporate status (or had it dissolved by a Secretary of State), those filing for Chapter 7 or 11 bankruptcy followed by dissolution, those following an assignment of benefit of creditors (i.e., ABC) protocol, or those who sold assets under distress to another company as part of a close-out process)). By these relatively simple metrics, we observed a high level of success among companies founded by MIT faculty. The results for the three departments are as follows:
Biology
As of 2019, 19 of the companies founded by Biology faculty have been acquired (33%), 20 went public (35%), and 11 (19%) have closed. 44 of the 57 companies (77%) received at least $1 million in venture capital, with 27 of 57 (47%) receiving more than $50 million. Both female-founded companies are private, and one has received more than $50 million in venture-capital investment.
Biological Engineering
As of 2019, four companies have been acquired (14%), five went public (17%), and six (21%) have closed. 24 of 29 companies (83%) received at least $1 million in venture-capital funding, with 11 of 29 (38%) receiving more than $50 million. One company founded by a female faculty member was acquired, and three companies founded by women received more than $50 million each in venture capital investment.
Chemical Engineering
As of 2019, 21 companies have been acquired (30%), 19 went public (27%), and nine (13%) have closed. 49 of 69 (71%) received at least $1 million in venture-capital funding, with 29 of 69 (42%) receiving more than $50 million. All five female-founded companies are currently active, two having received more than $1 million in venture-capital investment.
4. 40 “missing companies”: The impact of variable rates of company founding by women and men faculty in the seven departments analyzed to date
Although we have not yet studied all seven departments as carefully as the three described above, we did a simple calculation to ask how many additional companies would have been founded if the same fraction of women as men faculty in each department had founded companies, and if each had founded the same average number of companies as male-founder colleagues. The answer is that roughly 40 additional companies, mostly biotech and some tech, would have been founded.
5. Limitations
Our current study’s department-centric approach means that we have excluded faculty, perhaps many, who are or have contributed to the innovation ecosystem of biotechnology, since many faculty across disciplines at MIT engage in health-related research. It means we have included faculty who are members of the departments studied whose work may not be biotechnology-related. This is a limitation of our research design and scale to date.
We confirmed that our general results are robust to the inclusion of the 193 MIT faculty from the seven departments under study who have separated from the Institute, retired, or passed away between 2000 and 2019. This population includes 51 faculty members from the three departments highlighted here, and 31 females overall (16%). We identified 48 male founders and two female founders. Rates of BOD and SAB participation were similarly more skewed among this group than for current faculty.
6. Comparison of MIT’s results with Stanford University’s results
Of great interest is the similarity of our findings to those of Stanford University (Hanes, et al. 2018). As in the Stanford study, we found significant rates of commercialization by women faculty in some MIT engineering departments that contribute to the biotech start-up industry, but we also found a remarkable lack of participation by women faculty in basic biology departments, despite the fact that, in contrast to MIT, Stanford analyzed the biomedical-sciences departments in the School of Medicine as well as the Biology Department in the School of Humanities and Sciences. The Stanford study encompassed data from 2007-2014 and therefore did not capture changes over the past five years. Anecdotally, Professor Arvin, the senior author of this study, notes that more women biology faculty may be participating in commercialization activities at Stanford, a possibility we discuss further below.
Discussion and Conclusions
We examined participation by MIT women and men faculty members from three Science and four Engineering departments in the governance of science and technology start-up companies.
Our comparison across the seven departments highlighted the small number of women faculty in some departments and the variable rates of participation by women vs. men in different departments. To better understand this variability, we studied three departments in greater detail. We chose Biology, Biological Engineering (BE), and Chemical Engineering (CE), for two reasons: (1) The BBWG is particularly interested in biotech, and the faculty in these three departments have played an important role in the rise of this industry; (2) men and women faculty within each of these departments are similar in terms of career stage, and they work in similar-enough fields that neither differences in age or subfield should explain the variable rates of participation we see. (In several other departments, faculty work in diverse fields with potentially quite different commercialization rates.)
Two major conclusions, both consistent with published studies, emerge from our analysis of these three departments: (1) A marked underrepresentation of women faculty in Biology, per capita, relative to male colleagues, in founding start-ups and serving on their boards, and (2) similar rates of participation by women and men faculty along those dimensions, per capita, in Biological Engineering and Chemical Engineering. What could explain the difference?
Biological and Chemical Engineering: Much engineering research, even in academia, is focused on solving real-world problems, and founding companies is embedded in the engineering tradition. Studies have shown that most scientist-entrepreneurs are not “born” but “bred,” and adapt to the expectations of their training and environment. Students and postdocs may learn a commercial orientation from mentors, and they may be inclined to engage with the commercial sector themselves when they become faculty, including women. The fact that these women engage in commercialization may provide a roadmap for how institutions may help an entrepreneurial microclimate develop in other arenas.
In the preceding and following articles, we address some hypotheses that have emerged from this finding and describe some interventional “experiments” that the BBWG has initiated.
That said, we don’t know whether the experiences and outcomes are identical for women and men faculty in Engineering – or in Science – who found companies. Unlike in Biology, the numbers of women in Engineering have been historically low, so even though the per-capita rates between men and women are similar, the overall company-founding events are inevitably low, due to low numbers of women faculty.
Some women faculty have the perception that it is harder for them to raise capital than it is for male colleagues. National studies suggest that women are asked different questions when pitching investors, and data show that less than 3% of venture-capital dollars flow to women-founded companies. Other women faculty have had the perception that they are not invited to co-found companies with male colleagues when it might be appropriate to do so.
The first issue is discussed further below. The second is supported by our data for women in the three departments we studied in more detail: Of 26 MIT faculty in Biology, Chemical Engineering, and Biological Engineering who co-founded 27 companies with other MIT faculty, 26 of 26 co-founders were men.
Biology: The biotech industry grew out of scientific advances in the 1970s in molecular biology, a field without a tradition of commercialization. A number of early biotech companies were founded by businessmen who actively recruited university biology faculty, as in the well-known story of Genentech, the first U.S. biotech company. Genentech was founded in 1978 by UCSF’s Herb Boyer, who was recruited by Bob Swanson, a graduate of MIT’s Sloan School. Concerns that the commercialization of discoveries in molecular biology was not proceeding rapidly enough led to the passage in 1980 of the Bayh-Dole act. Bayh-Dole granted universities the ability to oversee the licensing of intellectual property arising from discoveries made by university faculty, trainees, and research staff through grants funded by taxpayer money to the universities. This change simplified the process of patenting and licensing – and, hence, commercialization.
Given these histories, the striking difference in commercialization rates by women vs. men faculty in Biology would seem to involve several questions: why women faculty were not recruited to found companies beginning in the 1970s-80s; why male faculty, once experienced themselves, did not bring women colleagues along; and why the difference in participation rates has persisted for so long. Any answer would require understanding why this gap has been seen at MIT, at Stanford, and at other leading research universities.
Extensive academic studies, and this report and Stanford’s 2018 study, have eliminated a number of possible explanations for the entrepreneurial gender gap among faculty in biological sciences. We know it is: a) not primarily a pipeline problem, b) not because women lack academic qualifications compared to men, c) not because women are “too busy” compared to men, and d) not because women lack interest in entrepreneurial activities. A relative lack of experience in commercial engagement may play a significant role, but this is a Catch-22 situation that stems from women faculty members so rarely having participated in the first 40 years of the industry. Nationally, there is a trend to jumpstart board diversity by electing first-time women and minority board members without prior commercial experience. We expect that this type of approach will be necessary to accelerate progress.
Experts who have studied the entrepreneurial gap are still seeking an explanation, but divide the possibilities into factors affecting supply and factors affecting demand (Ding et al., 2012, Stephan and El-Ganainy, 2006.) Among the former, they have considered gender differences in attitudes to risk, competition, the “selling” and “promotion” of science, types of research, and geographic location; among the latter, they have explored the role of networks, the preferences of venture capitalists, and “gender discounting.”
Our work through the BBWG has illuminated some of these possibilities, and in so doing has helped to shape the action plans outlined in the two accompanying articles. On the demand side, our meetings revealed frustration by VCs over the difficulty of identifying appropriate women faculty, particularly women with experience in the industry, as noted above. On the supply side, women faculty reported experiences that may help to explain their low rates of participation. These ranged from a woman faculty member in the 1970s being told that she could not participate because “businessmen don’t work with women,” to the present day when multiple women related nearly identical anecdotes about “pitching while female.” One woman reported being warned before making a pitch not to take female trainees with her, and instead to take male students with her, so as to be taken more seriously. In terms of raising money, we learned that it can be preferable for a woman faculty member to have a male co-founder, because, as one woman told us, “women faculty are not heard – industry is far behind academia.” Anecdotes about pitching while female are nearly identical from university to university, including at MIT, Stanford, and Johns Hopkins.
Conclusion: Discoveries in the labs of university faculty are not only the source of many biotech companies, but faculty train the next generation of scientists, some of whom will become entrepreneurs, so faculty participation has a particularly significant impact on the industry. Our results to date, and input from discussions among BBWG members, have helped to shape an action plan to close the entrepreneurial gender gap at the faculty level in the Boston biotech industry. Over time, the efforts of the Data Group should help to determine whether these plans have succeeded.
