

Highlights from the MIT 2020 Quality of Life Survey
Amy K. Glasmeier, Ken Goldsmith, Gregory Harris, Jonathan SchwarzMIT has administered five major Quality of Life (QOL) surveys. The first survey of faculty and staff was run by the ad hoc Committee on Work and Family in 1989. The second survey was sponsored by the MIT Council on Family and Work in October of 2001. In 2012, the survey underwent a major revision, including aligning many of the questions with MIT’s quadrennial survey of faculty. The 2012 survey was repeated in 2016. The 2016 survey is one of the most used survey datasets administered by Institutional Research.
In 2013 and 2017, a separate survey was administered to all enrolled students at MIT and covered some of the same topics as the faculty and staff survey. In 2020, the two surveys were combined, and for the first time the entire MIT community was surveyed at the same time.
The 2020 MIT Quality of Life Survey captures a snapshot of our campus community just before COVID and the evacuation of campus. On January 28, 2020, more than 26,000 faculty, staff, and students on campus and at Lincoln Laboratory were asked to share their views about MIT. The survey closed on March 11 with an overall response rate of 50%. As with all surveys run by Institutional Research, the survey data are treated as confidential, and the results are not presented in a way that identifies individual respondents. Readers are advised that the results of the survey may have been affected by issues that arose in the fall related to gifts provided by Jeffrey Epstein. Dramatic changes in context are known to have an influence on subjective judgements of survey participants.
The 2020 survey relied heavily on previous Quality of Life surveys. Because multiple surveys were combined to form this survey, not everyone saw every question. For example, faculty were not asked about extracurricular activities, and postdoctoral scholars were not asked about their experiences with tenure. Overall the 2020 survey had 288 questions. Institutional Research has posted an interactive Tableau visualization which includes selected results from previous surveys as well as the 2020 QOL (see: https://ir.mit.edu/surveys).
The results of the 2020 survey provide the Institute with the tools to understand the intersection between work and non-work activities. In general, respondents reported being satisfied at MIT, working hard to succeed in their studies and jobs, and sometimes finding it difficult to manage all they have to do.
Satisfaction
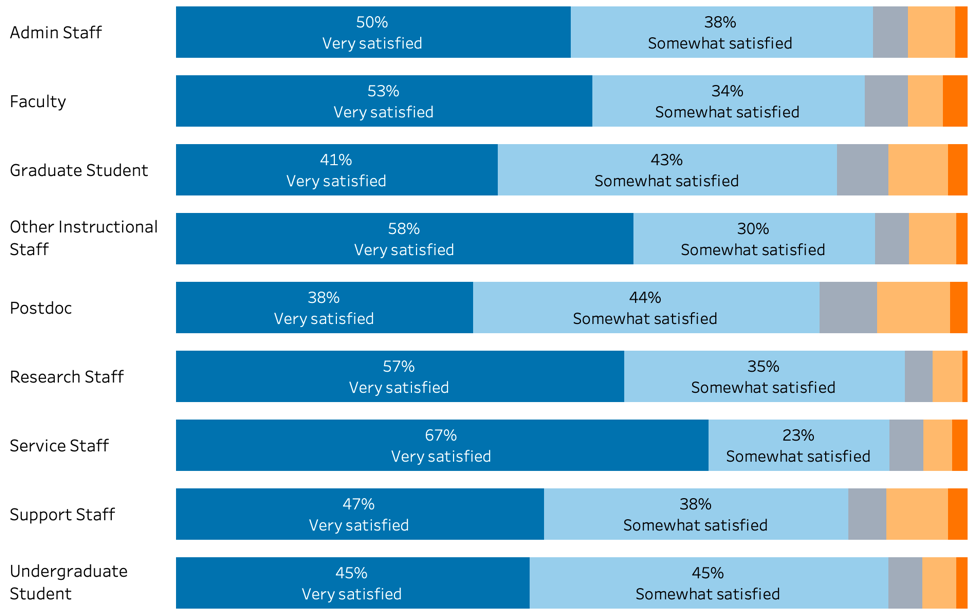
The first question on the survey asked everyone about their satisfaction in their particular role (e.g., faculty, staff, student) at MIT. Overall, 87% of respondents reported being “very satisfied” or “somewhat satisfied.” The percentages varied by role and location. On average, Lincoln Laboratory staff reported higher levels of satisfaction than main campus staff. Among students, undergraduate students reported higher levels of satisfaction than graduate students.
Over time, overall satisfaction has dropped for students and main campus faculty and staff. Faculty satisfaction (percent somewhat or very satisfied) was 92% in 2012, 93% in 2016, and 87% in 2020. Similarly, for on-campus staff, the figures were 90% in 2012 and 2016 and 86% in 2020. At Lincoln Laboratory, overall satisfaction was in the low 90%s each of the three years.
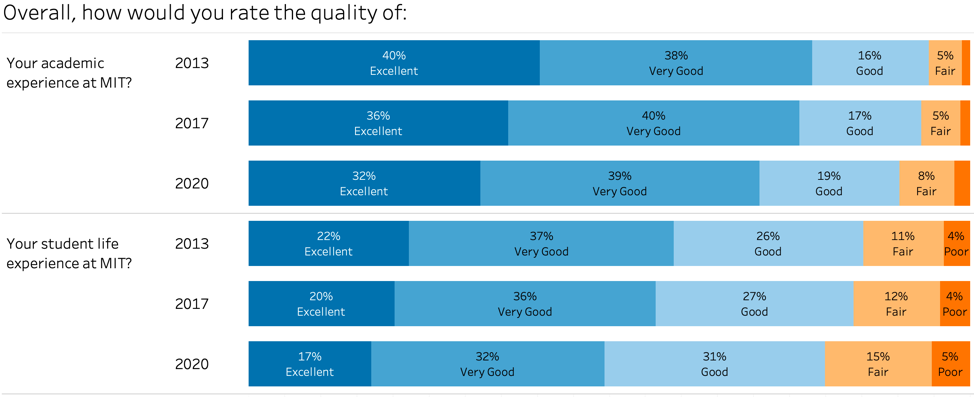
Students showed a marked decrease among those who answered “very satisfied”; 51-52% of students said they were very satisfied in 2013 and 2017, compared to 42% in 2020.This is reflected in their ratings of the quality of their academic and student life experience. In 2013, 78% of students reported that their academic experience was excellent or very good. 59% said their student life experience was excellent or very good. In 2020, those percentages declined to 71% for academic experience and 49% for student life experience.
Overall, how satisfied are you in your role at MIT?
Quality of Academic and Student Life Experience
Another item on the survey asked about the balance between life inside and outside MIT. 79% or more of administrative, support, service, research, and other instructional staff said they were somewhat or very satisfied with their ability to integrate the needs of their work with their personal/family life. Faculty and postdoctoral scholars reported lower levels of satisfaction on this measure (69% and 66%, respectively). Across all groups, the results looked similar over time.
Students were asked a similar question on the survey: “How satisfied are you with your ability to balance academics and other aspects of your life?” 62% of students answered somewhat or very satisfied, down from 67% in 2017.
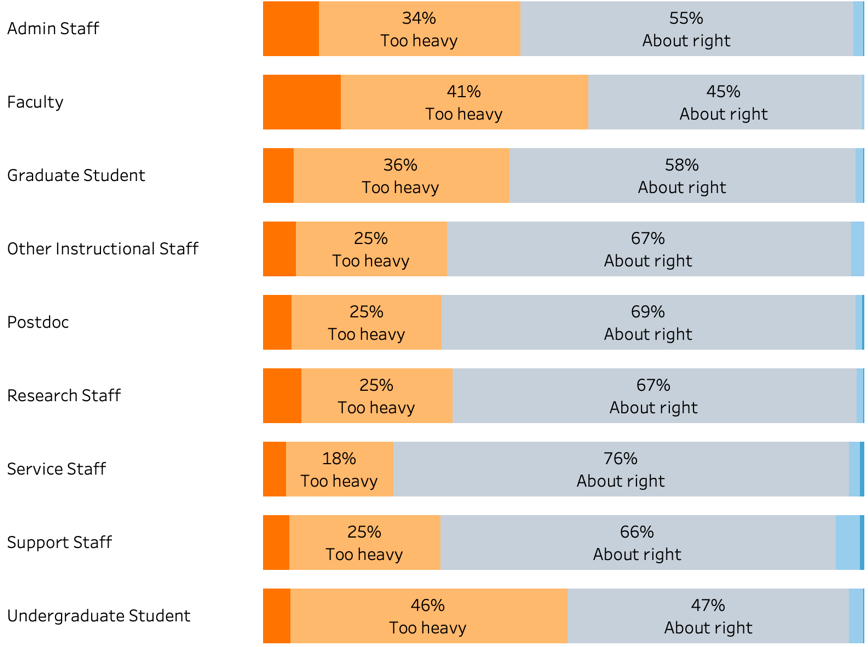
Workload
To further explore workload balance issues, the survey asked respondents to rate their workload at MIT. Very few respondents reported that their workload was too light or much too light. The percentage who reported their workload to be about right ranged from 82% of service staff to 45% of the faculty. A higher percentage of undergraduate students (51%) said their academic and research workload was too heavy or much too heavy compared to graduate students (41%).
Overall, how would you rate your workload?
For main campus and Lincoln Laboratory staff, the survey asked a series of questions about work arrangements, including how much freedom employees had regarding their work schedule. A sizable percentage of respondents said they had the choice to work some portion of their time from home or another location; 51% of administrative staff, 63% of other instructional staff, 60% of postdoctoral scholars, and 54% of research staff answered “very much” or “a moderate amount.” Having the choice to work remotely, however, was less possible for support staff at 31% or service staff at 20%. [Obviously these results would have been quite different had the survey been administered after the stay-at-home order!].
MIT staff were also asked to indicate their level of agreement with this statement: I am expected to be accessible (through email, phone, pager, etc.) outside of normal work hours. More than half of other instructional staff, postdoctoral scholars, and administrative staff somewhat or strongly agreed.
The survey included a question about whether or not employees worked off-site during regular work hours. The results varied widely by location and role. In general, a smaller percentage of Lincoln Laboratory staff reported working remotely than main campus staff. More than 40% of main campus other instructional staff, research staff, and administrative staff said they worked remotely, compared to just 6% of service staff.
Finally, faculty and staff were asked if they had the resources (equipment, training, budget, etc.) they needed to do their job well. At Lincoln Laboratory, the responses to this question looked roughly the same by employee type; 79‐83% at Lincoln said they somewhat or strongly agreed. There was more variation among main campus employees, ranging from 69% agreement (service staff) to 83% agreement (postdoctoral scholars).
Climate
Another goal of the survey was to gain perspectives on the general climate at MIT, as well as the climate in departments, labs, centers, and other units. The survey had a number of questions about department/unit climate, among them one that asked respondents to rate their level of agreement or disagreement with: My department/unit is a good fit for me. 78-87% (depending on student level and employee type) said they somewhat or strongly agreed with this statement.
Unlike the overall satisfaction measure, which experienced noticeable drops over time in some areas, the good fit question looks relatively stable.
Below are additional items asked of faculty and staff in this section of the survey. The figure next to each statement is the percent who answered “Somewhat agree” or “Strongly agree.”
• In my workplace everyone is treated with respect (76%)
• My unit’s procedures are fair and equitable (70%)
• I have a voice in the decision-making that affects the direction of my unit (62%)
• I can navigate the unwritten rules concerning how I should conduct myself in my position at MIT (80%)
• My workplace is free from bias and discrimination (66%)
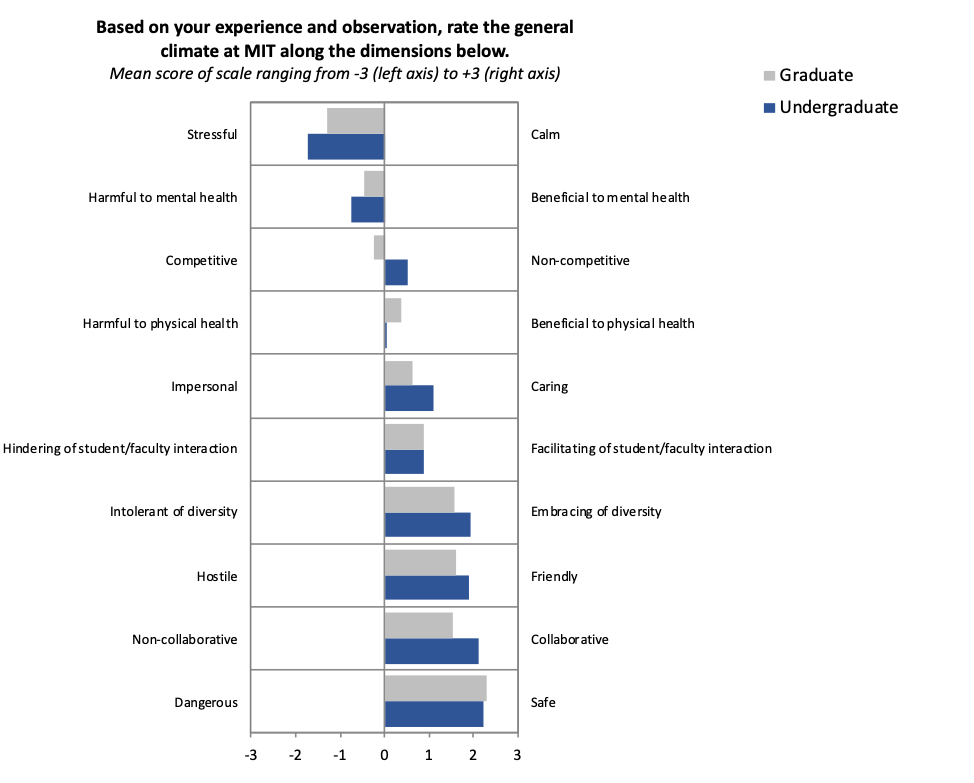
From a list of 10 different dimensions, students were asked to rate the general climate at MIT using a six-point scale. At one end of the scale was one word (e.g., Dangerous), and at the other end was another word (e.g., Safe). The figure shows the mean score for each word pairing, separately for undergraduate students and graduate students.
For the word pairing Stressful: Calm, many more students selected “Stressful” than “Calm.” Graduate students, on average, rated MIT’s environment as more competitive than undergraduate students. Conversely, undergraduate students rated MIT as more collaborative than graduate students. Both undergraduate and graduate students rated MIT’s environment as more harmful to mental health than helpful.
Student Rating of General Climate at MIT
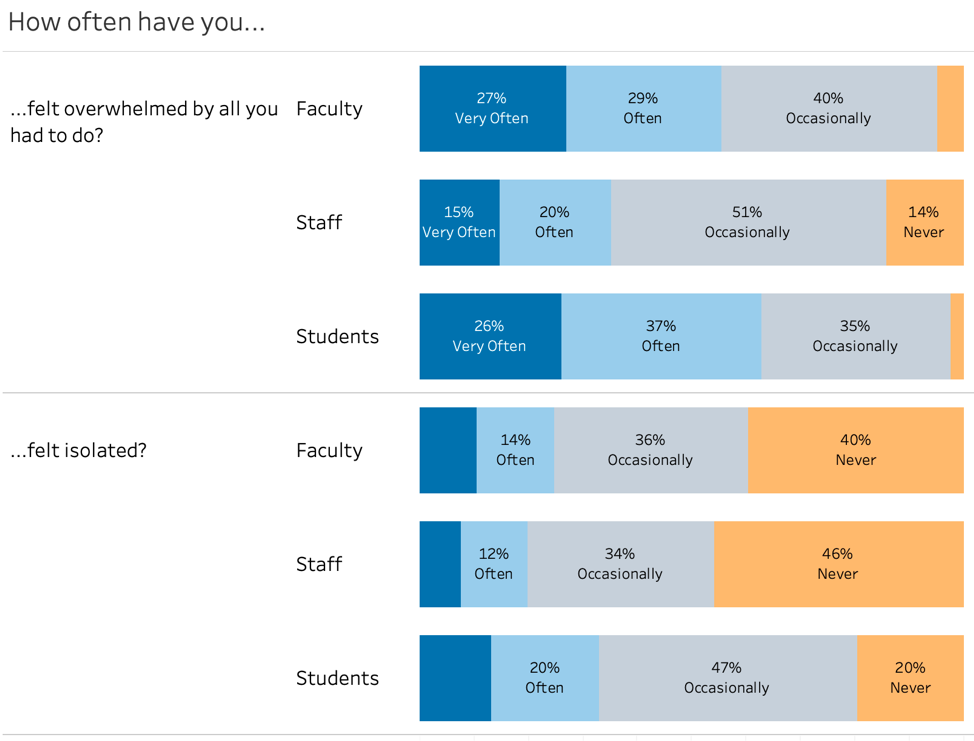
Feeling Overwhelmed & Isolated
Another section of the survey focused on potential sources of stress and the frequency of feeling overwhelmed and isolated. When asked how often they felt overwhelmed by all they had to do, more than half of students (65% of undergraduates, 60% of graduate students) and faculty (56%) said “Often” or “Very Often.” Staff reported a lower percentage at 35% overall, ranging from 40% of postdoctoral scholars to 13% of service staff.
On average, a lower percentage of respondents reported feeling isolated than feeling overwhelmed. A third of students said they often or very often felt isolated, compared to a quarter of faculty and 19% of staff.
Feeling Overwhelmed & Isolated
The survey included a bank of questions asking respondents to rate potential sources of stress during the current year. [Note: While some of the stress items were asked of all students, faculty, and staff, some items were unique to role and location, e.g., scholarly productivity was only asked of faculty, other instructional staff, main campus research staff, and postdoctoral scholars.] For each potential source of stress, the 4-point scale ranged from “not a source of stress” to “very stressful.” Below are listed the top three sources of stress for a sample of groups at MIT as measured by the percentage who answered very or moderately stressful.
• Faculty: Lack of time to think and reflect (57%), Scholarly productivity (56%), and Securing funding for research (54%).
• Postdoctoral scholars: Securing my next professional position (73%), Scholarly productivity (71%), and Cost of housing (67%).
• Staff at Lincoln Laboratory: Commuting to Lincoln Laboratory (34%), Managing household responsibilities (32%), and Cost of housing (25%).
• Students: Balancing multiple commitments (70%), Expectation to perform as well as my peers (58%), and Concerns about life after MIT (50%).
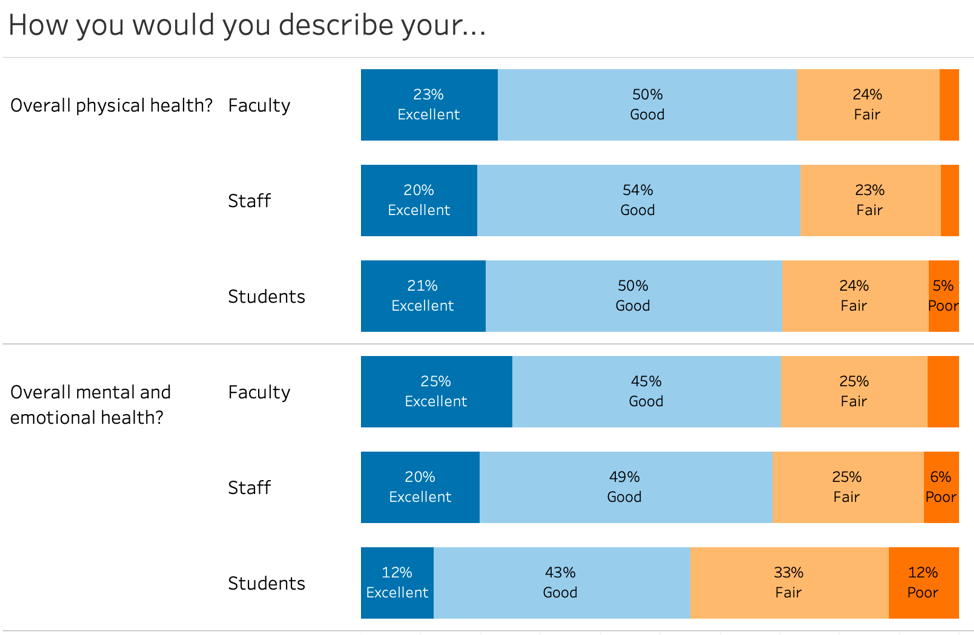
Physical & Mental/Emotional Health
Ethical Concerns
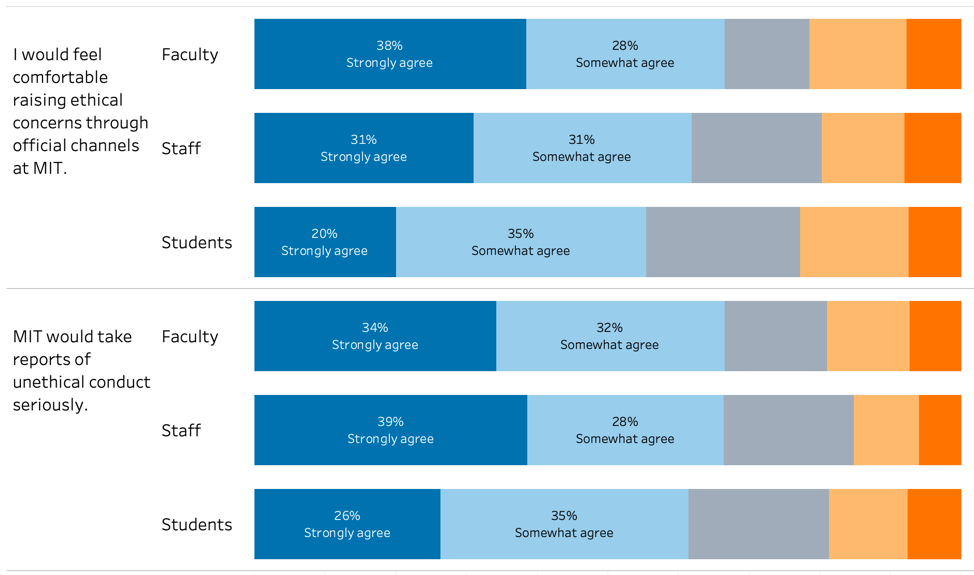
For the first time, the 2020 survey included two questions about raising ethical concerns. Sixty-six percent of faculty somewhat or strongly agreed that they would feel comfortable raising ethical concerns through official channels at MIT and that MIT would take reports of unethical conduct seriously. For on-campus staff, these percentages were 57% and 62%, respectively. Students reported similar figures at 55% and 61%. For Lincoln Laboratory staff, the percentages were much higher at 73% and 79%.
Raising Ethical Concerns
More complete results from the 2020 MIT Quality of Life survey can be found at: https://ir.mit.edu/qol-2020.
